| Editor's choice |
FlashCard Pro V2.52
FlashCard Pro is an incredibly powerful and yet easy-to-use self study progr...
Virtual Poet
Virtual Poet can help make you the poet you have always wanted to be!
MB Kabbalah Astrology
This is a Kabbalah Astrology based on the Kabbalistic Tree of Life.
Pitch Ability Test
Test your Pitch Ability: Measure pitch take over and pitch retention.
Speedo Shopper
Let Speedo Shopper help you create shopping or errand lists fast!
Learn To Speak Chinese
It is very useful in improving your spoken Chinese and building your vocabulary.
Univerter
Univerter combines advanced units conversion and calculation abilities into ...
|
|
Get award winning software programs from the most asked for webs sites! Get popular computer software and uncommon programs. Test software system, shareware, free tools, and demo verions to download in miscellaneous lists. On Softempire you can always find an updated package, or try the newest editions of your most liked PC programs, apps, and relax softwares. To download the required utilities to recieve, use an easy to use program sorter or a smart compendium. The Softempire accumulation is always extended: if there is the hottest edition of computer software you seek, it is probably to be in the net fullest apps library!
Collection of free to try mathematics software. You'll find different calculators, math education software, math puzzles, math games and many other math applications. All software is free to downloads regardless of license type.
|
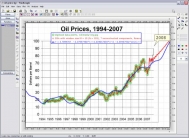
FindGraph
|
|
Download
|
Buy now!
|
View screenshots
|
Vendor Price: $ 49.95
License: Shareware
File Size: 3.21 Mb
Version: 2.01
Release Date:
11 Dec 2008
OS: Win98, WinME, WinXP, Windows2000, Windows2003
System Requirements:
IE 5.0
Company: UNIPHIZ Lab
Languages:


|
|
FindGraph is comprehensive graphing, curve fitting, and digitizing tool. FindGraph offers 12 generic fits, including linear regression, logistic functions, fourier approximation, neural networks, B-splines and parametric curves least squares approximations, plus a library of over 300 industry-specific 2D formulas. Built-in Wizard helps to apply different curve fits to discover the model that best describes the data. Last version includes the peak fitting features. The software enables you to smooth, interpolate, apply FFT and Wavelet filters, subtract, differentiate, integrate, and transform data and curves. The program comes with 200 built-in common graphing 2D functions support for polar, cartesian, and parametric equations. Built-in Wizard helps to digitize the data. The program supports OLE automation and can be built-in to other software applications.
|
More to download:
csXGraph
ActiveX control to draw 2D pie charts, bar charts and line graphs. Display the graphs, export to file (GIF, PNG, BMP) or data stream or copy to the clipboard. Properties allow full control over colours and fonts. Free trial.
Aepryus Graph
Aepryus Graph is a 32bit function plotting application capable of 2D and 3D shaded plots of normal and parametric equations, using Cartesian, polar, cylindrical and spherical coordinates. Functions will animate with the inclusion of a time variab...
Atropos-SB
Atropos-SB is a multi-channel system to record and archive sound data received through microphone, telephone, voice modem, radio stations etc. and stores the data on PC. You can use Atropos-SB as phone logger, automatic voice notebook.
Shudly
Shudly is your virtual PC assistant which can fast search and browse internet, schedule your tasks and appointments, send email and speak for you with its cool voice. Shudly can also tell amazing jokes and shows cool pictures from its online gallery.
CyberMatrix Class Scheduler
CyberMatrix Class Scheduler is a simple to use single or multi-user application for scheduling student's classes. The software can be used by schools and other institutions that need to quickly schedule classes.
Evaluating Crossnumber Puzzles
Middle-School (grades 5 through 9) math program. Students solve crossnumber puzzles by evaluating simple expressions. Program uses only positive integers...
SimplexNumerica
2D/3D technical graphics plotting and data analysis software for your plotting needs. Curve fitting, FFT and a presentation software! Download a demo of our analysis and plotting software!
Math Games Multiplication
Math Games - Multiplication software is designed to help K-3 students in mastering multiplication tables for numbers 1 to 10. The game is easy and fun to play. It is free for personal use.
|
|
|
Windows Backup |
Looking for backup software? Try Handy Backup - automatic data backup to DVD, CD, FTP, network, or Online. Client-server enterprise backup software.
|
|
Top Downloads |
Freeware program to rename files & folders & Multimedia files wi
Hotspot Shield secures your Internet connection from hackers
Protect your computer from viruses and malicious programs.
|
|