|
Innovative utility downloads from the most popular in download webs sites! Use the popular apps categories, determine the most recent renews of the asked-for programmes, and try right away! Do not lose opportunity to try the most asked-for programs: utilise SoftEmpire directory to try solutions for free. Meet the website of free programs and software releases. Search among operating system applications, download controllers, antiviruses, and all other kinds of applications for your computer or mobile phones!
Resources for software development: IDE & Editors, programming, testing, configuration management, databases and components. Huge collection of free components and utilities. Free download of all files.
|
PDF Chart Creator Dynamic Link Library
|
|
Download
|
Buy now!
|
View screenshots
|
Vendor Price: $ 59.99
License: Shareware
File Size: 0.39 Mb
Version: 1.2
Release Date:
24 Jun 2007
OS: Win95, Win98, WinME, WinNT 4.x, Windows2000, WinXP, Windows2003, Windows Vista Starter, Windows Vista Home Basic, Windows Vista Home Premium, Windows Vista Business, Windows Vista Enterprise, Windows Vista Ultimate, Windows Vista Home Basic x64
System Requirements:
Minimum: Intel Pentium processor or equivalent, 16 Mb RAM, 2Mb disk space
Company: Utility Warrior
|
|
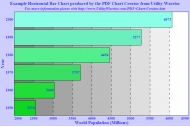
The PDF Chart Creator Dynamic Link Library (DLL) allows you to create area charts, bar charts, line charts and pie charts from data as high quality PDF documents.
The conversion process is fully controlled through the provided Application Programming Interface (API) which is provided with many language specific Application Program Interface files (Microsoft C/C++, Visual Basic 6, Clarion, Borland C++ Builder, LabVIEW, .net Interop Services for C#, C++, J#, Visual Basic) that allows a Software Developer to include the full features of the utility in their own application.
The PDF Chart Creator is NOT an Adobe Acrobat plug-in and it does NOT require Adobe Acrobat in order to run or produce PDF documents.
Features include:
Add royalty free creation of area charts, bar charts, line charts and pie charts from data into PDF quickly and easily into your own application.
Create charts with a VERY LOW file size and at HIGH QUALITY (which can be scaled up without any "blockyness" or "jaggies").
Customise the look and feel of all parts of a chart (size, colors, axes, titles, labels, legends, positioning etc).
Automatically calculate and have displayed the "line of best fit" (which uses linear regression analysis) to supporting chart types.
Automatically calculate and have displayed the "moving average" to supporting chart types.
Password protect output PDF document.
Optionally include a bookmark in the output PDF for the chart.
Set PDF permissions to restrict printing, copying and modification.
Set PDF meta information (author, title, subject, keywords, creator, producer, creation date).
Set preferred PDF viewer options (center window, hide toolbar, hide menu bar, hide window user interface, fit window, page mode none/outlines/thumbnails/full screen, page layout single page/one column/two column left/two column right).
Does NOT require Adobe Acrobat software for creation.
Free upgrades to all future versions.
|
More to download:
CharTTool
CharTTool is an advanced stock market charting software that instantly allows you to display several technical charts of stocks, mutual funds, currencies or market indices in intraday or end of day chart format. Technical analysis is also available.
Disk Piecharter
Disk Piecharter for Windows is a Graphical Disk Explorer that shows disk usage per file and per directory in a piechart. You can zoom in and out on piechart segments (directories). You can also delete files and directory trees with it.
FlowChart.NET
The FlowChart.NET component adds to applications the ability to create and present workflow, flowchart and process diagrams, database entity-relationship diagrams, organizational, hierarchy and relationship charts, network schemes, graphs and trees.
Text Pilot Library
Text Pilot library extends standard Windows API function TextOut. Library provides 3 following functions: * text output drawing based on a line * text output drawing based on a circle * text output drawing based on a curve...
CCXI XML Data Island Library
Take the strain off your sever. The CCXI XML Data Island Library and ASP table control allow your users to view data without having to contact the server constantly. CCXI makes it simple to display, page and sort data without server round trips.
BlackJ Scripting Library
The Blackj library is a standard ECMA 262 3rd Edition implementation for embedded scripting in C/C++, Delphi applications. The ECMA 262 standard defines the requirements for languages similar to JavaScript or JScript.
9Rays.Net TreeView for ASP.NET
9Rays TreeView for ASP.NET (FlyTreeView) is a treeview control. ASP.NET treeview control features .net data binding, drag-and-drop, viewstate support, customizable styles and behaviors, load-on-demand, checkboxes, client object model, context menu.
SMExport suite for Delphi/CBuilder
SMExport suite allow to export a data into:
-Excel, Lotus 1-2-3, QuattroPro spreadsheets
-MS Excel, MS Word, MS Access (DAO/MS Jet)
-Text (fixed or CSV), SYLK, DIF
-HTML, XML
-RTF (Rich Text format)
-SQL-script
-Paradox/DBase files
Advanced Data Export
Advanced Data Export Component Suite for Borland Delphi and C++ Builder will allow you to save your data in the most popular office programs formats for the future viewing, modification, printing or web publication.
|
|
|
Windows Backup |
Looking for backup software? Try Handy Backup - automatic data backup to DVD, CD, FTP, network, or Online. Client-server enterprise backup software.
|
|
Top Downloads |
Schedule, resume and accelerate downloads by up to 5 times with this accelerator
FrostWire - Download MP3s, Videos & Movies for FREE
Log into web sites with a single click. Fill web form details automatically.
|
|